Have a Question?
Power Draws for the Vault w/ UPS Uptime Estimates
Power Draws
The following section is intended to help those that are designing a network and need to calculate the power load on a specific circuit or create an energy budget for a new project. The data may also help a Vault owner analyze an overheating/stress issue.
Test Conditions
All tests were performed on Vaults at an ambient temperature of 74F with either Crucial 8GB DDR3 or DDR4, and either a Protectli 120GB mSATA, Protectli 120GB M.2 or a Kingston 250GB NVMe. No peripherals or USBs were plugged in and the Vaults were set upright on their rubber feet on a workbench with no active airflow over each unit. The Vaults were given a few inches of clearance on each side and nothing was stacked on top of or above them.
Max Power Draw Tests
In the first round of tests, the Vaults used for testing were "cold", or at ambient room temperature. These tests show a higher wattage draw due to there not being any CPU thermal throttling. Without throttling, the cores will function close to their max frequency including a turbo mode if they have one and will draw the most power they are capable of drawing. These test results should be used when budgeting for peak power draws from equipment on a single circuit.
| VAULT MODEL | CPU Average Frequency in MHz @ temp in C | CPU Throttling % | Ubuntu at Idle (in avg watts) | Ubuntu & s-tui (in avg watts) | Ubuntu & s-tui & iperf (in avg watts) | Peak Draw Ubuntu & s-tui & iperf (in peak watts) | Power Supply |
| FW2B - J3060 | 2480 @ambient | 0 | 4.8 | 8.4 | 8.8 | 9.2 | 40w Power Supply |
| FW4B - J3160 | 2240 @ambient | 0 | 5.4 | 11.0 | 11.4 | 12.1 | 40w Power Supply |
| FW4C - J3710 | 2240 @ambient | 0 | 5.4 | 11.0 | 11.4 | 12.1 | 40w Power Supply |
| V1210 - N5105 | 2800 @ambient | 0 | 6.3 | 20.7 | 21.1 | 24.4 | 48w Power Supply |
| V1410 - N5105 | 2800 @ambient | 0 | 6.3 | 20.7 | 21.1 | 24.4 | 48w Power Supply |
| VP2410 - J4125 | 2600T @ambient | 0 | 7.2 | 13.8 | 14.5 | 15.5 | 40w Power Supply |
| VP2420 - J6412 | 2600T @ambient | 0 | 8.2 | 16.0 | 18.5 | 19.7 | 40w Power Supply |
| VP4630 - 10110U | 3400T @ambient | 0 | 11.8 | 33.4 | 34.1 | 34.9 | 60w Power Supply |
| VP4650 10210U | 4200T @ambient | 0 | 10.4 | 35.8 | 37.1 | 44.1 | 90w Power Supply |
| VP4670 - 10810U | 4900T @ambient | 0 | 9.4 | 43.5 | 54.2 | 57.6 | 90w Power Supply |
| VP6650 - 1235U | 2700 @ambient | 0 | 15.4 | 48.8 | 49.5 | 60.1 | 120w Power Supply |
| VP6670 - 1255U | 3500@ ambient | 0 | 17.2 | 54.8 | 55.8 | 64.6 | 120w Power Supply |
| FW6A - 3865U | 1800 @ambient | 0 | 6.9 | 13.2 | 13.8 | 14.1 | 40w Power Supply |
| FW6B - 7100U | 2400 @ambient | 0 | 7.0 | 16.9 | 18.5 | 18.9 | 60w Power Supply |
| FW6Br2 - 8130U | 3400T @ambient | 0 | 7.6 | 32.0 | 35.1 | 36.0 | 60w Power Supply |
| FW6C - 7200UX | 3100T @ambient | 0 | 7.4 | 31.3 | 32.9 | 34.1 | 60w Power Supply |
| FW6D - 8250U | 3400T @ambient | 0 | 7.5 | 58.4 | 60.6 | 61.9 | 60w Power Supply |
| FW6E - 8550U | 3600T @ambient | 0 | 7.8 | 70.1 | 74.2 | 80.1 | 90w Power Supply |
Heat Saturated Power Draw Test
In the second round of tests the Vaults were measured after running an s-tui stress test. s-tui is a terminal UI that can be used for monitoring your Vault. s-tui allows monitoring of a Vaults CPU temperature, CPU frequency, power and utilization via a graphical user interface (GUI). It was written in Python and doesn't require root privilege to access and use, it uses very little system resources, and it doesn't require configuration files to use its core features.
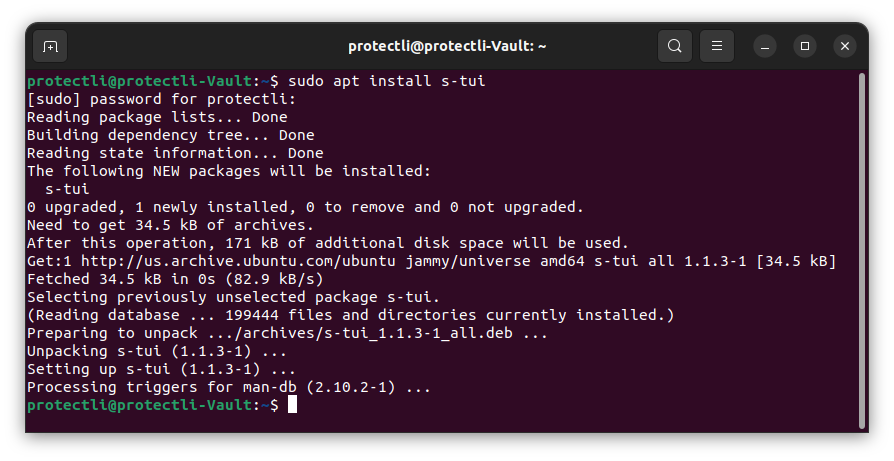
s-tui can be downloaded on Ubuntu via the console with the command: $ sudo apt install s-tui

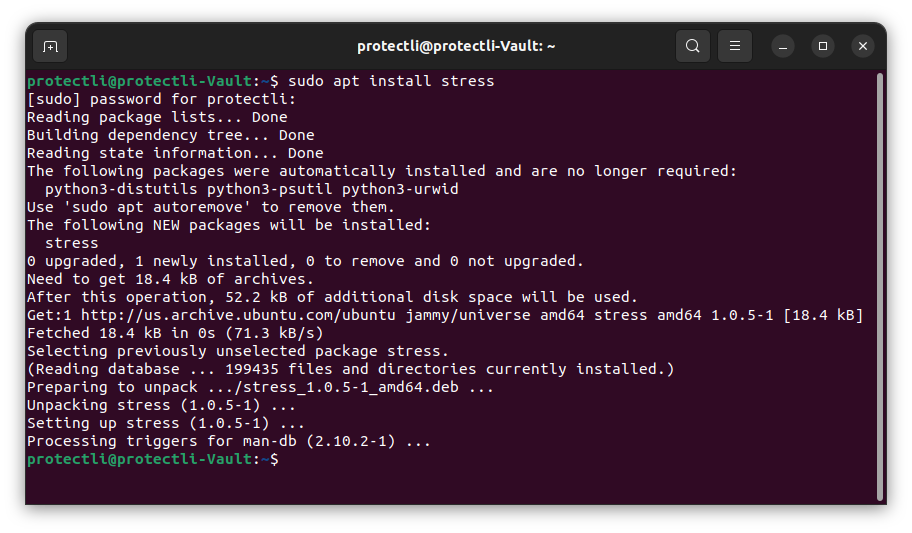
To use the stress function within s-tui you will need to download the "stress" package with the command: $ sudo apt install stress.

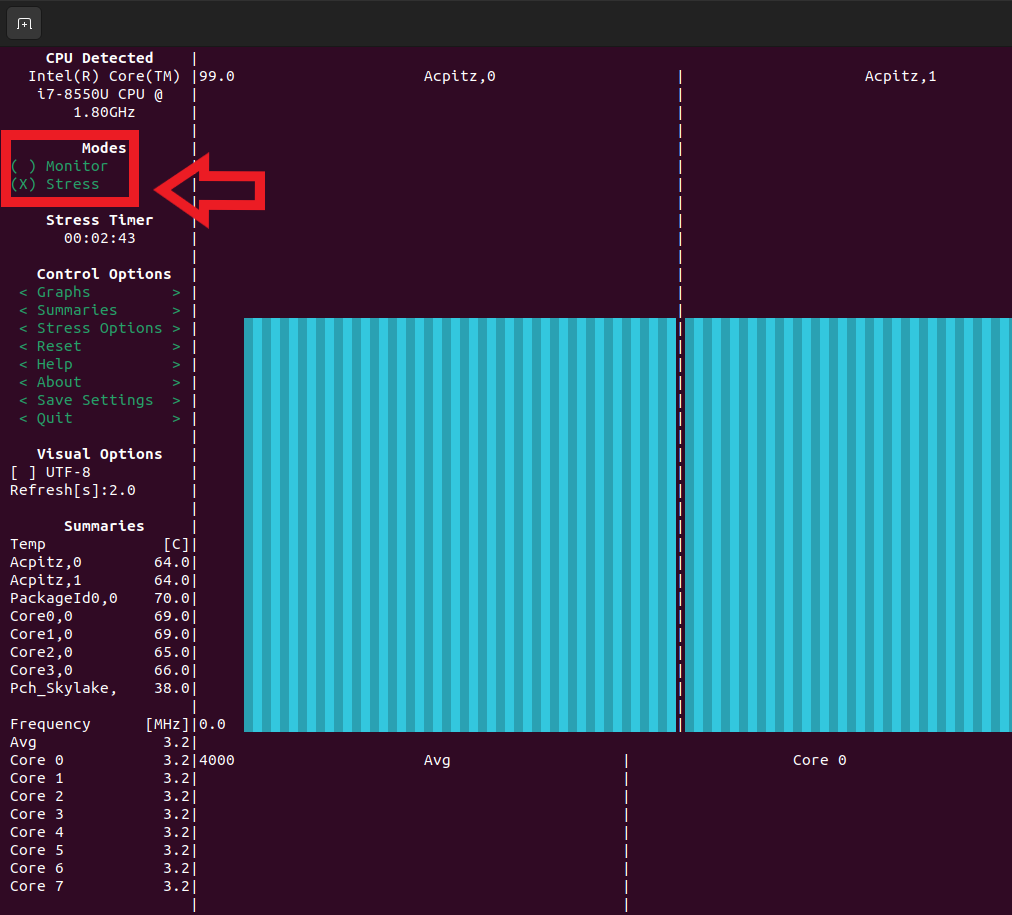
Once both package are downloaded type "s-tui" in the command line to open the GUI. s-tui starts in Monitor mode. To stress test your CPU click on "Stress" in the upper left hand corner.
s-tui was run on Ubuntu 22.04 "Jammy Jellyfish" for one hour to bring the internal temperatures up to the highest typically seen under a full 100% CPU load known as "heat saturated". The results show a lower power draw on the Vaults that have CPUs with an Intel Turbo mode due to CPU throughput throttling and reflect the amount of throttling the CPU is using to keep the temperature below 78C.

***NOTE: These test conditions are well beyond typical use conditions for a Vault. Most applications are not so CPU intensive that they require constant Turbo.
| VAULT MODEL | CPU Average Frequency in MHz @ temp in C | CPU Throttling % | Ubuntu at Idle (in avg watts) | Ubuntu & s-tui (in avg watts) | Ubuntu & s-tui & iperf (in avg watts) | Power Supply |
| FW2B - J3060 | 2480 @51C | 0% | 4.2 | 8.4 | 8.6 | 40w Power Supply |
| FW4B - J3160 | 2240 @61C | 0% | 5.6 | 11.0 | 11.2 | 40w Power Supply |
| FW4C - J3710 | 2640 @54C | 0% | 4.9 | 6.7 | 7.7 | 40w Power Supply |
| V1210 - N5105 | 2200 @60C | 21.43% | 7.0 | 16.1 | Currently being tested | 48w Power Supply |
| V1410 - N5105 | 2200 @55C | 21.43% | 7.0 | 18.6 | Currently being tested | 48w Power Supply |
| VP2410 - J4125 | 2300 @53C | 11.5% | 7.3 | 13.5 | 14.1 | 40w Power Supply |
| VP2420 - J6412 | 2600 @72C | 0% | 8.1 | 16.0 | 18.4 | 40w Power Supply |
| VP4630 - 10110U w/ 8GB DDR4 | 2600 @64C | 23.6% | 12.4 | 23.7 | 24.3 | 60w Power Supply |
| VP4650 - 10210U | 1830 @69C | 59.14% | 11.4 | 27.7 | 30.8 | 60w Power Supply |
| VP4670 - 10810U | currently in testing | currently in testing | currently in testing | currently in testing | currently in testing | currently in testing |
| FW6A - 3865U | 1800 @41C | 0% | 6.7 | 13.3 | 13.5 | 40w Power Supply |
| FW6B - 7100U | 2400 @55C | 0% | 8.1 | 17.8 | 18.2 | 60w Power Supply |
| FW6Br2 - 8130U | 2750 @79C | 19.2% | 7.8 | 22.4 | 22.9 | 60w Power Supply |
| FW6C - 7200UX | 2500 @64C | 20.4% | 6.9 | 19.6 | 20.9 | 60w Power Supply |
| FW6D - 8250U | 2500 @78C | 27.5% | 7.6 | 28.8 | 30.0 | 60w Power Supply |
| FW6E - 8550U | 2470 @78C | 28.6% | 8.0 | 29.9 | 32.1 | 90w Power Supply |
UPS Uptime Estimates
The following section is intended to help those looking to estimate the uptime their Vault will have upon an AC power loss to their network. Two tests were conducted to test the estimated uptime of a Vault running on our 44.4Wh UPS (Uninterruptible Power Supply) and our 88.8Wh UPS. The first test was performed running the Vaults with OPNsense 22.1 "Observant Owl" at the default configuration with no traffic. This replicates a power loss at home or a small office during off-business hours. The second test was performed running the Vaults with the default configuration OPNsense between two Vaults, one as the iPerf3 server and the other as the iPerf3 client. This allowed us to measure the power draw of a Vault seeing passthrough traffic instead of being the origination or termination of the iPerf stream. This test replicated peak traffic conditions a Vault would experience on a network as an edge-of-network firewall appliance.
The resulting estimated uptime is shown in Watt Hours which is the amount of energy equal to using 1 watt for 1 hour. For example, a Vault drawing 4.4watts will last 10 hours on our 44.4Wh battery: 44.4Wh/4.4watts=10.
OPNsense 22.1 @ Idle Uptime Estimate
This test was performed to estimate the time a Vault will continue running on our 44.4Wh and 88.8Wh UPS once AC power is lost. OPNsense was run with default settings and no additional added packages. No traffic was allowed to pass through to replicate the least amount of power a Vault firewall would draw on an idle network.
OPNsense 22.1 @ Max Throughput Uptime Estimate
This test was performed to estimate the time a Vault will continue running on our 44.4Wh and 88.8Wh UPS once AC power is lost. OPNsense was run with default settings and no additional added packages. Iperf3 traffic was set up from LAN to WAN (running at ~930Mbps) to replicate maximum traffic conditions on a 1Gbps network and the amount of power a Vault would draw.
VAULT
MODEL Approx Wattage Draw
Running OPNsense
@ idle Est Uptime
44.4Wh UPS
in Hours Est Uptime
88.8Wh UPS
in Hours Est CPU Usage
Running OPNsense
& iPerf3 Approx Wattage Draw
Running OPNsense
& iPerf3 Est Uptime
44.4Wh UPS
in Hours Est Uptime
88.8Wh UPS
in Hours
FW2B - J3060 7.6 5.84 11.68 53% 8.8 5.045 10.091
FW4B - J3160 7.4 6.00 12.00 31% 9.4 4.723 9.447
VP2410 - J4125 7 6.34 12.69 23% 9.1 4.879 9.758
VP2420 - J6412 9.7 4.58 9.15 17% 11.2 @ 2.5G 3.964 7.929
VP4630 -10110U 12.4 3.58 7.16 20% 16.9 @ 2.5G 2.627 5.254
VP4650 - 10210U
VP4670 - 10810U
FW6A - 3865U 9.6 4.63 9.25 67% 11.6 3.828 7.655
FW6B - 7100U 7.9 5.62 11.24 32% 11.3 3.929 7.858
FW6B - 8130U 7.9 5.62 11.24 10% 10.9 4.073 8.147
FW6C - 7200UX 9.3 4.77 9.55 21% 10.9 4.073 8.147
FW6D - 8250U 9.5 4.67 9.35 13% 12.0 3.700 7.400
FW6E - 8550U 9.7 4.58 9.15 9% 12.2 3.639 7.279
| VAULT MODEL | Approx Wattage Draw Running OPNsense @ idle | Est Uptime 44.4Wh UPS in Hours | Est Uptime 88.8Wh UPS in Hours | Est CPU Usage Running OPNsense & iPerf3 | Approx Wattage Draw Running OPNsense & iPerf3 | Est Uptime 44.4Wh UPS in Hours | Est Uptime 88.8Wh UPS in Hours | |
| FW2B - J3060 | 7.6 | 5.84 | 11.68 | 53% | 8.8 | 5.045 | 10.091 | |
| FW4B - J3160 | 7.4 | 6.00 | 12.00 | 31% | 9.4 | 4.723 | 9.447 | |
| VP2410 - J4125 | 7 | 6.34 | 12.69 | 23% | 9.1 | 4.879 | 9.758 | |
| VP2420 - J6412 | 9.7 | 4.58 | 9.15 | 17% | 11.2 @ 2.5G | 3.964 | 7.929 | |
| VP4630 -10110U | 12.4 | 3.58 | 7.16 | 20% | 16.9 @ 2.5G | 2.627 | 5.254 | |
| VP4650 - 10210U | ||||||||
| VP4670 - 10810U | ||||||||
| FW6A - 3865U | 9.6 | 4.63 | 9.25 | 67% | 11.6 | 3.828 | 7.655 | |
| FW6B - 7100U | 7.9 | 5.62 | 11.24 | 32% | 11.3 | 3.929 | 7.858 | |
| FW6B - 8130U | 7.9 | 5.62 | 11.24 | 10% | 10.9 | 4.073 | 8.147 | |
| FW6C - 7200UX | 9.3 | 4.77 | 9.55 | 21% | 10.9 | 4.073 | 8.147 | |
| FW6D - 8250U | 9.5 | 4.67 | 9.35 | 13% | 12.0 | 3.700 | 7.400 | |
| FW6E - 8550U | 9.7 | 4.58 | 9.15 | 9% | 12.2 | 3.639 | 7.279 |
Devices used to measure power draws
Kill A Watt EZ P3
Baldr BA3091
